Alan Mutter was paying attention when The NAA tried to quietly dump its latest revenue numbers on the afternoon before Thanksgiving. And what he saw was grim, including continued falloff in all categories, and the second quarter in a row of declining interactive numbers.
The performance in the third quarter was affected only partially by the worldwide financial panic that froze the credit markets in mid-September, throttling the already waning demand for hiring, auto sales and home purchases.
The outlook for the final period of the year is worse, when the three classified verticals are likely to experience the full impact of the economic meltdown.
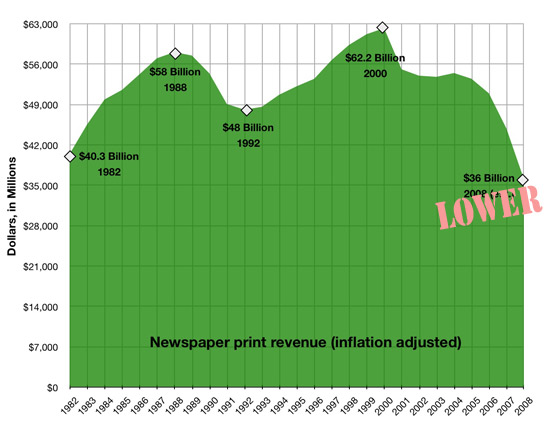
So it looks like I’ll need to update this chart I created at the end of Q2, showing constant-dollar print revenue at newspapers dropping below 1982 levels. When I made that estimate in September, I said 2008 print revenue would hit $36 billion, a number that needs to come down by at least a half billion (applying 2007 Q4 decline percentages, clearly an optimistic projection), if not a whole lot more.


 Martin Langeveld says
November 29, 2008 at 11:58 amWhat's even more interesting is if you graph the sales data as a fraction of GDP, rather than in constant dollars. This eliminates the rather illusory peak your chart shows in 2000.
In 1956, newspaper ad revenue hit a post-1949 high of 0.742% (about 3/4 of 1 percent). With the exception of a 5 or 6-year rally during the 1980s, it has been almost constantly downhill ever since. Depending on your guesses of 2008 revenue and final GDP, the 2008 fraction will be at about 0.260% (barely over 1/4 of 1 percent). So in 52 years, newspaper have lost about 2/3 of their GDP share.
Moreover, the current decline looks amazingly like that chart they showed the execs at the API summit a few weeks back: http://www.americanpressinstitute.org/pages/res…
 Martin Langeveld says
November 29, 2008 at 1:58 pmWhat's even more interesting is if you graph the sales data as a fraction of GDP, rather than in constant dollars. This eliminates the rather illusory peak your chart shows in 2000.
In 1956, newspaper ad revenue hit a post-1949 high of 0.742% (about 3/4 of 1 percent). With the exception of a 5 or 6-year rally during the 1980s, it has been almost constantly downhill ever since. Depending on your guesses of 2008 revenue and final GDP, the 2008 fraction will be at about 0.260% (barely over 1/4 of 1 percent). So in 52 years, newspaper have lost about 2/3 of their GDP share.
Moreover, the current decline looks amazingly like that chart they showed the execs at the API summit a few weeks back: http://www.americanpressinstitute.org/pages/res…
 Martin Langeveld says
November 29, 2008 at 6:58 pmWhat's even more interesting is if you graph the sales data as a fraction of GDP, rather than in constant dollars. This eliminates the rather illusory peak your chart shows in 2000.
In 1956, newspaper ad revenue hit a post-1949 high of 0.742% (about 3/4 of 1 percent). With the exception of a 5 or 6-year rally during the 1980s, it has been almost constantly downhill ever since. Depending on your guesses of 2008 revenue and final GDP, the 2008 fraction will be at about 0.260% (barely over 1/4 of 1 percent). So in 52 years, newspaper have lost about 2/3 of their GDP share.
Moreover, the current decline looks amazingly like that chart they showed the execs at the API summit a few weeks back: http://www.americanpressinstitute.org/pages/res…