According to The Newsosaur, Alan Mutter, the first-half 2008 newspaper revenue details, released by the Newspaper Association of America, represent the worst numbers in a dozen years.
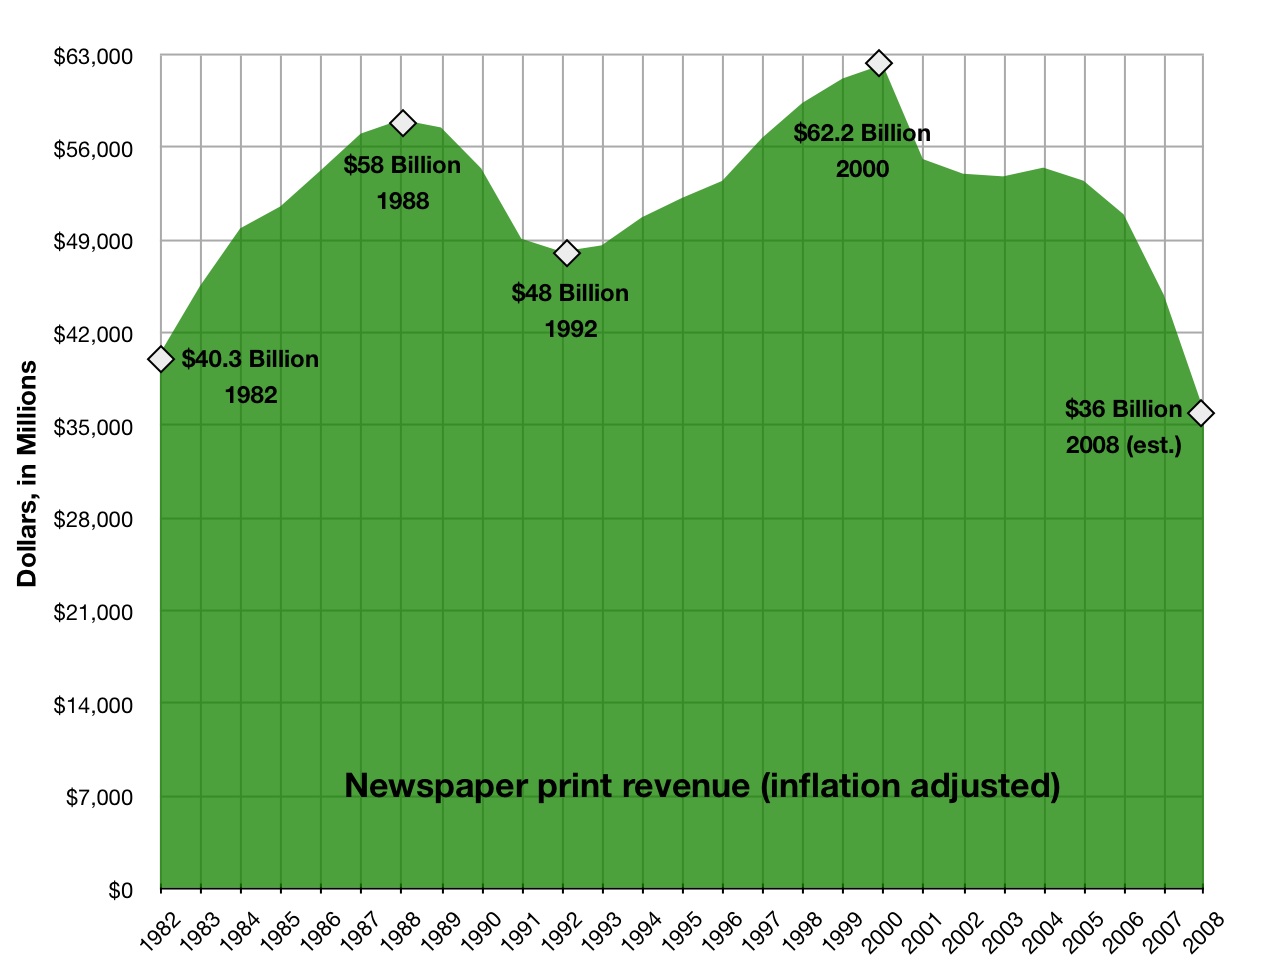
But that’s comparing 1996 dollars to 2008 dollars. If you look at print revenue performance in constant 2008 dollars, the industry hasn’t seen numbers this grim since 1982 (click to see the chart in full size):
What’s really bracing about that chart is how the rate of decline clearly accelerates in the past few years.
This chart does not include online revenue, which NAA has tracked since 2003.
(Obligatory warning: I was an English major in college, not a stats geek. This constant-dollar hack was made with simple web tools and the original data from the NAA. If this is way off, please let me know.)


